- Home
- Viewing or Sorting Files
- Tools in the ViewNX-i Window
- Showing Histogram
Font size
- S
- M
- L
Showing Histogram
You can show histograms of an image in the [Image Viewer] mode or [Full Screen] mode. Also, you can show red (R), green (G) and blue (B) color channels respectively, or all color channels (RGB) at the same time.
Histograms can be shown only for still images.
About "Histogram"
"Histogram" is a curve chart showing the brightness distribution of an image. The horizontal axis shows image brightness, and the vertical axis shows the number of pixels. The bright image has the peak of curve at the right part of chart, but the dark image has the peak of curve at the left part of chart. If the bottom of the curve reaches the rightmost end of graphic, the image has lost highlights. If it reaches the leftmost end of graphic, the image has lost shadows.
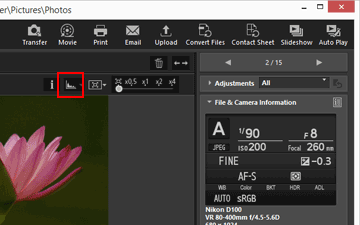
- Click
 on the Image Control bar.
 Histograms are shown.
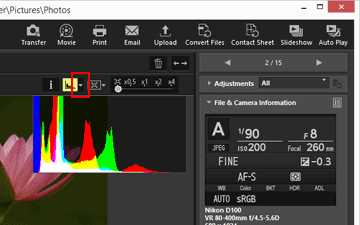
- Click
 on the Image Control bar to select the display style of histograms.
 The histogram style will change.Click
 on the Image Control bar again to hide the histograms.
Other available methods
- In the [Image Viewer] mode, locate the cursor on [View] menu > [Viewer] > [Histogram] and check [Show Histogram].
- Press the "Space" key.
Histogram styles
- When you select [RGB], red, green, and blue channels of the image overlap in the same display area. For coloring details when selecting [RGB], refer to "Coloring of histogram".
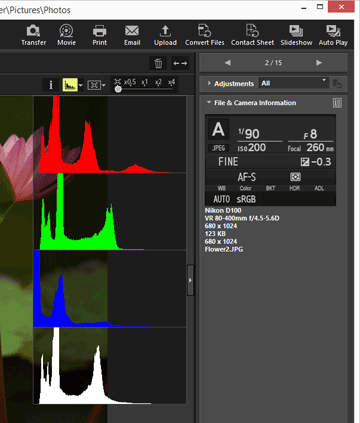
- When you select [R/G/B], red, green, and blue channels are respectively shown in order.
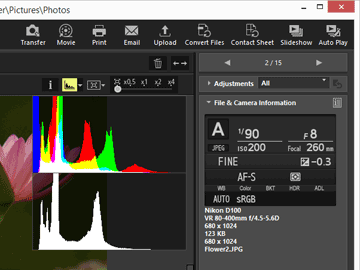
- When you select [Brightness], the distribution of brightness is shown under the [RGB] or [R/G/B] graph. Uncheck [RGB] and [R/G/B] to show only brightness distribution.
[RGB] and [Brightness] are selected:

[R/G/B] and [Brightness] are selected:

The histograms will remain even if you switch to another image. They will also remain even if you switch to the [Full Screen] mode.
Note
If the height of the Image View area is short, histograms are not fully displayed, with their lower part hidden. Change the histogram style, or adjust the thumbnail size or the ViewNX-i window.
Histogram on the [Adjustments/Metadata] palette
A histogram is displayed in the lower area of the [Adjustments/Metadata] palette.
- The histogram on the [Adjustments/Metadata] palette is displayed when only one thumbnail is selected.
- [R/G/B], which shows red, green, and blue channels in descending order, is not available. Select either [RGB], [R], [G], [B], or [Brightness] to display the corresponding histogram one at a time.
- When the histogram palette is closed, click [Histogram] to open it.
Coloring of histogram
When you select [RGB] as histogram style, individual red, green, and blue histograms are superimposed over one another. Areas where individual histograms overlap are displayed in different colors.
Red
Red channel
Green
Green channel
Blue
Blue channel
Yellow
The area where Red and Green channels are superimposed
Magenta
The area where Red and Blue channels are superimposed
Cyan
The area where Green and Blue channels are superimposed
White
The area where all color channels are superimposed
- Related Items
- Showing Lost Highlights
- Showing Lost Shadows
