
- Home
- Detailed Operations of Picture Control Utility 2
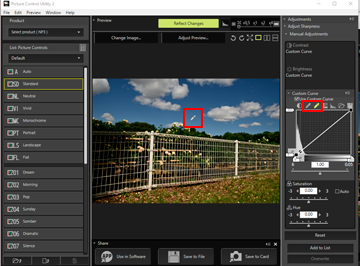
- Creating/Editing Custom Picture Control
- About Custom Curve
Font size
- S
- M
- L
About Custom Curve
Outline of tone curve
[Custom Curve] is a tone curve that shows the relationships between input (original image colors) and output (how the original image colors are reproduced in the final image). The default tone curve is set to a straight line. This means that the image is output with the original colors that were input.
The input image colors are placed on the horizontal axis. The shadow (dark part of an image) is reflected on the left; the highlight (bright part of an image) on the right; and the halftone in the center. On the horizontal axis, the leftmost end indicates the minimum value (0) and the rightmost end indicates the maximum value (255). The minimum value indicates the area of an input image that is completely black, and the maximum value indicates the area of an input image that is completely white.
The output image colors are placed on the vertical axis. The allowable minimum value (0) to be output is placed at the bottom, and the allowable maximum value (255)to be output at the top.
- Shadow
- Highlight
- Input black point
- Input white point
- Output white point
- Tone curve
- Output black point
[Custom Curve] is represented by an input value between 0 and 255; however, it is actually obtained at 16-bit accuracy, resulting in 255 being processed as 65535. This enables you to sufficiently maintain the image quality of 12-bit RAW images.
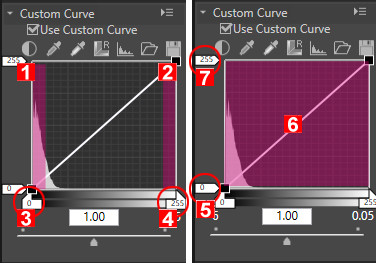
White and black points
The four corners of the tone curve are referred to as white and black points. The black point of an image indicates the darkest color tone (minimum value), and the white point indicates the brightest color tone (maximum value). The default black point for both the input and output values is set to 0. The darkest color tone value of the actual input image (original image) may be greater than 0. Changing the input value of a black point to the darkest color tone of the actual image will generate a steep inclination of a tone curve, resulting in enhanced contrast of the entire image without reducing the shadow accuracy. If the original image does not actually contain the color tone equivalent to the maximum value, reduce the white point value in order to adjust it to the brightest color tone of the actual image.
To obtain a desired effect, specify the white point and black point levels on the input (horizontal axis), and change those levels on the output (vertical axis) to fit the actual contrast between the brightest and darkest parts of the image. If the darkest color tone of the image is actually brighter than solid black, raise the output level of the black point to obtain a natural color tone.
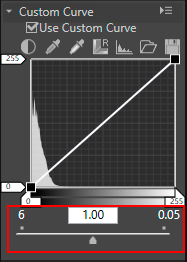
Input level
The following methods are available for adjusting the input levels of the white and black points.
Automatic contrast adjustment
- Click
 .
.
 The white and black points are specified automatically. The brightest part on an image is then set to white and the darkest part to black. Redistribute the tone, and adjust the contrast of the entire image.
Adjusting the white and black points with sliders
- Drag the horizontal axis slider horizontally.
 This slider is used to adjust the white and black points to a histogram.Drag the white point input slider
 and the black point input slider
  horizontally.Setting the black point input slider to the lowest input value shown in the histogram will result in the minimum output value that matches the tone of the darkest part of the image. This will generate a steep inclination of a tone curve, resulting in enhanced contrast without damaging the shadow details.In the same way, setting the white point input slider to the highest input value shown in the histogram will result in the maximum output value that matches the tone of the brightest part of the image. This will enhance the contrast without damaging highlight details.
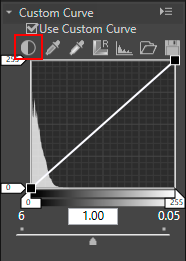
Image sampling with dropper tool
- Click
 to specify the white point of an image or click
  to specify the black point of an image.
 To specify the white and black points, you can also use the actual image for sampling. This function is useful because it enables you to select the darkest part within the details of the image and to specify the value of the black point. This enables you to eliminate unnecessary details that are darker than the specified black point value in the final image. It also enables you to select the brightest part of important details in the final image and match it to the value of the white point.To specify a white point, click, check that the cursor has changed into the dropper tool, and click on the brightest part of the image.In the same way, to specify a black point, click, check that the cursor has changed into the dropper tool, and click on the darkest part of the image.
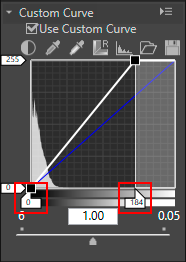
Output level
Drag the white point output slider  and black point output slider
  vertically to specify the white point and black point output levels.
and black point output slider vertically to specify the white point and black point output levels.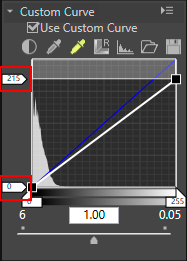
Tone curve
The tone curve shows the curve relationship between input (original image colors) and output (how the original image colors are reproduced in the final image). Editing the tone curve enables you to adjust the input and output values. The default tone curve is set to a straight line. This means that the image is output with the original colors that were input.
Reshaping the tone curve changes the relationships between the input and output, enabling you to finely adjust the brightness and contrast in a specific tonal range. For example, setting a steep inclination of the tone curve in a specific tonal range will increase the accuracy of the relevant part to be enhanced. Also, changing the tone curve to set the output value to be higher than the input value in a specific tonal range will result in a brighter tone. Also, changing the tone curve to set the input value to a lower output value will result in a darker tone.
Add a new anchor point
- Drag any position of the line and add an anchor point.
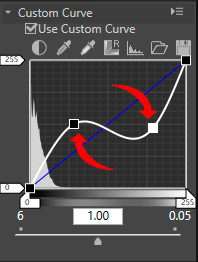 Up to 20 anchor points can be added. The added anchor points can be moved again by dragging them.
Delete an anchor point
- Click the anchor point to delete, and drag it outside the tone curve.
You can also use the "Delete" key to delete an anchor point.
Reset a tone curve
- Click
 .
.
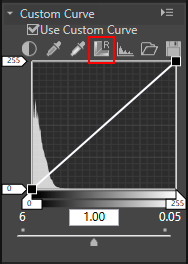 The tone curve is reset and returns to the default straight line.
Gamma correction
Drag the slider horizontally to change the gamma value. Dragging it to the left makes the halftone of the image brighter and dragging to the right makes the halftone darker.